
Skip to content
Next Level Property Management
> nlpm://searchLoading index…
  • Quick actions

    Talk to us/contact
  • Reno market data/market-data
  • Find an apartment/rentals
  • Resident portal/go/resident-portal
  • Client portal/go/client-portal
  • Call (775) 502-8287

Free template

Multifamily acquisition underwriting model

Underwrite an apartment purchase the way a lender or investor will: a ten-year projection, a loan sized by LTV, DSCR and debt yield, full returns and sensitivity grids that show what moves them.

  • Excel, Sheets, Numbers
  • Sample property included
  • 9 tabs

Get the template

Inside the workbook

What you get, tab by tab

Tab 1

Dashboard

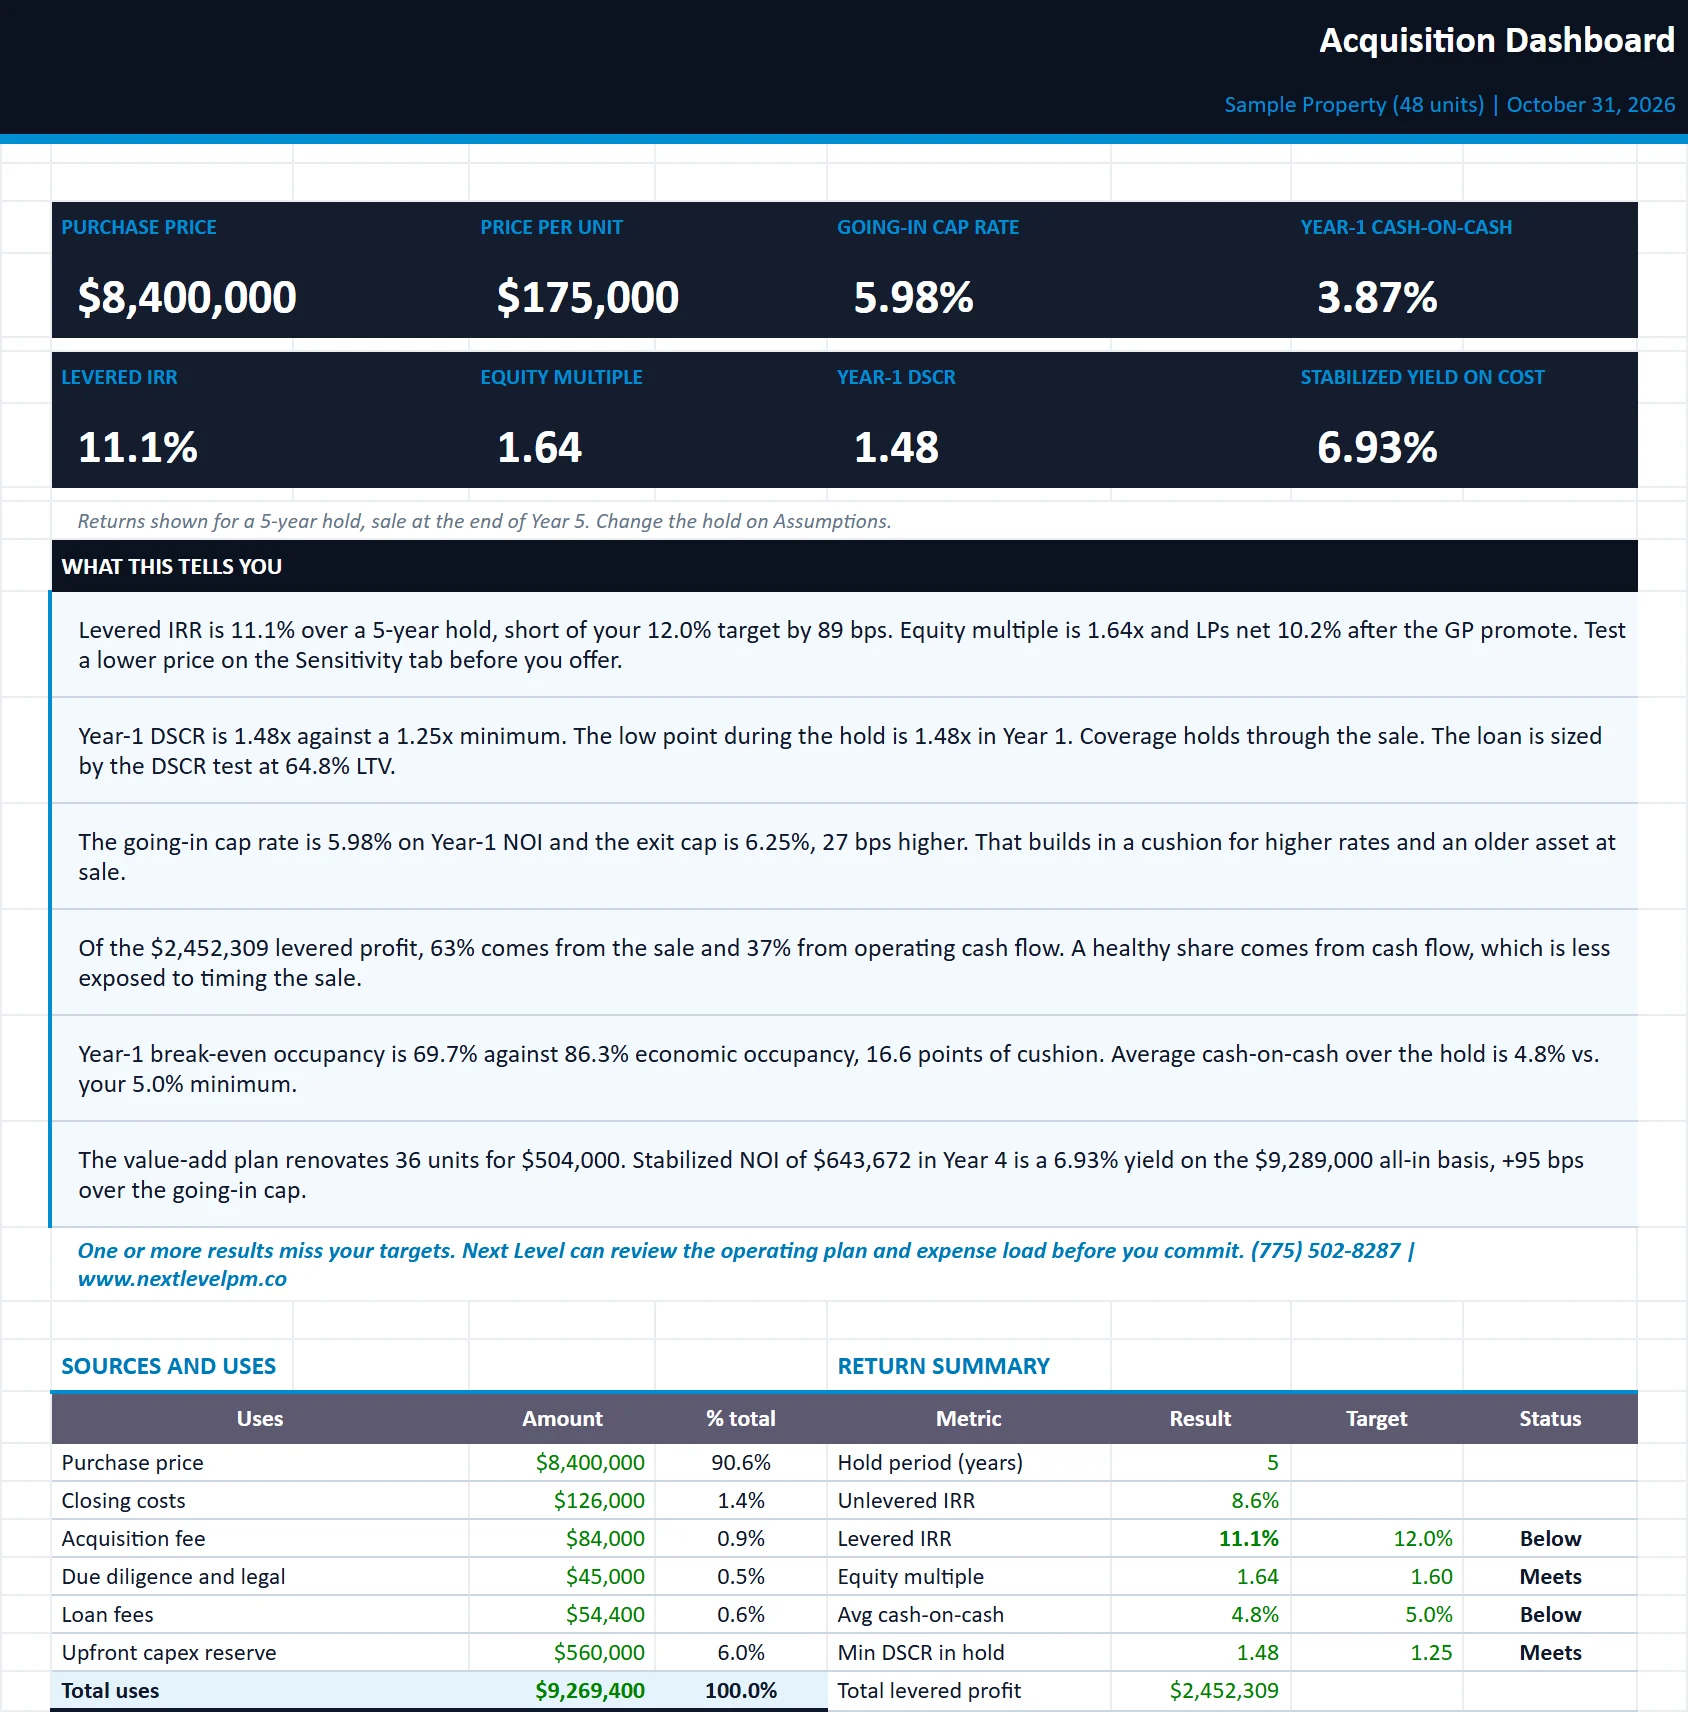
Headline returns, KPI tiles, sources and uses, plain-English insights, annual cash flow and NOI charts, and the model checks.

acquisition-underwriting-model.xlsx
The Dashboard tab of the acquisition-underwriting-model workbook, filled in with the sample property
DashboardPro FormaSensitivityInvestment SummaryAssumptionsUnit MixDebtReturns

Tab 2

Pro Forma

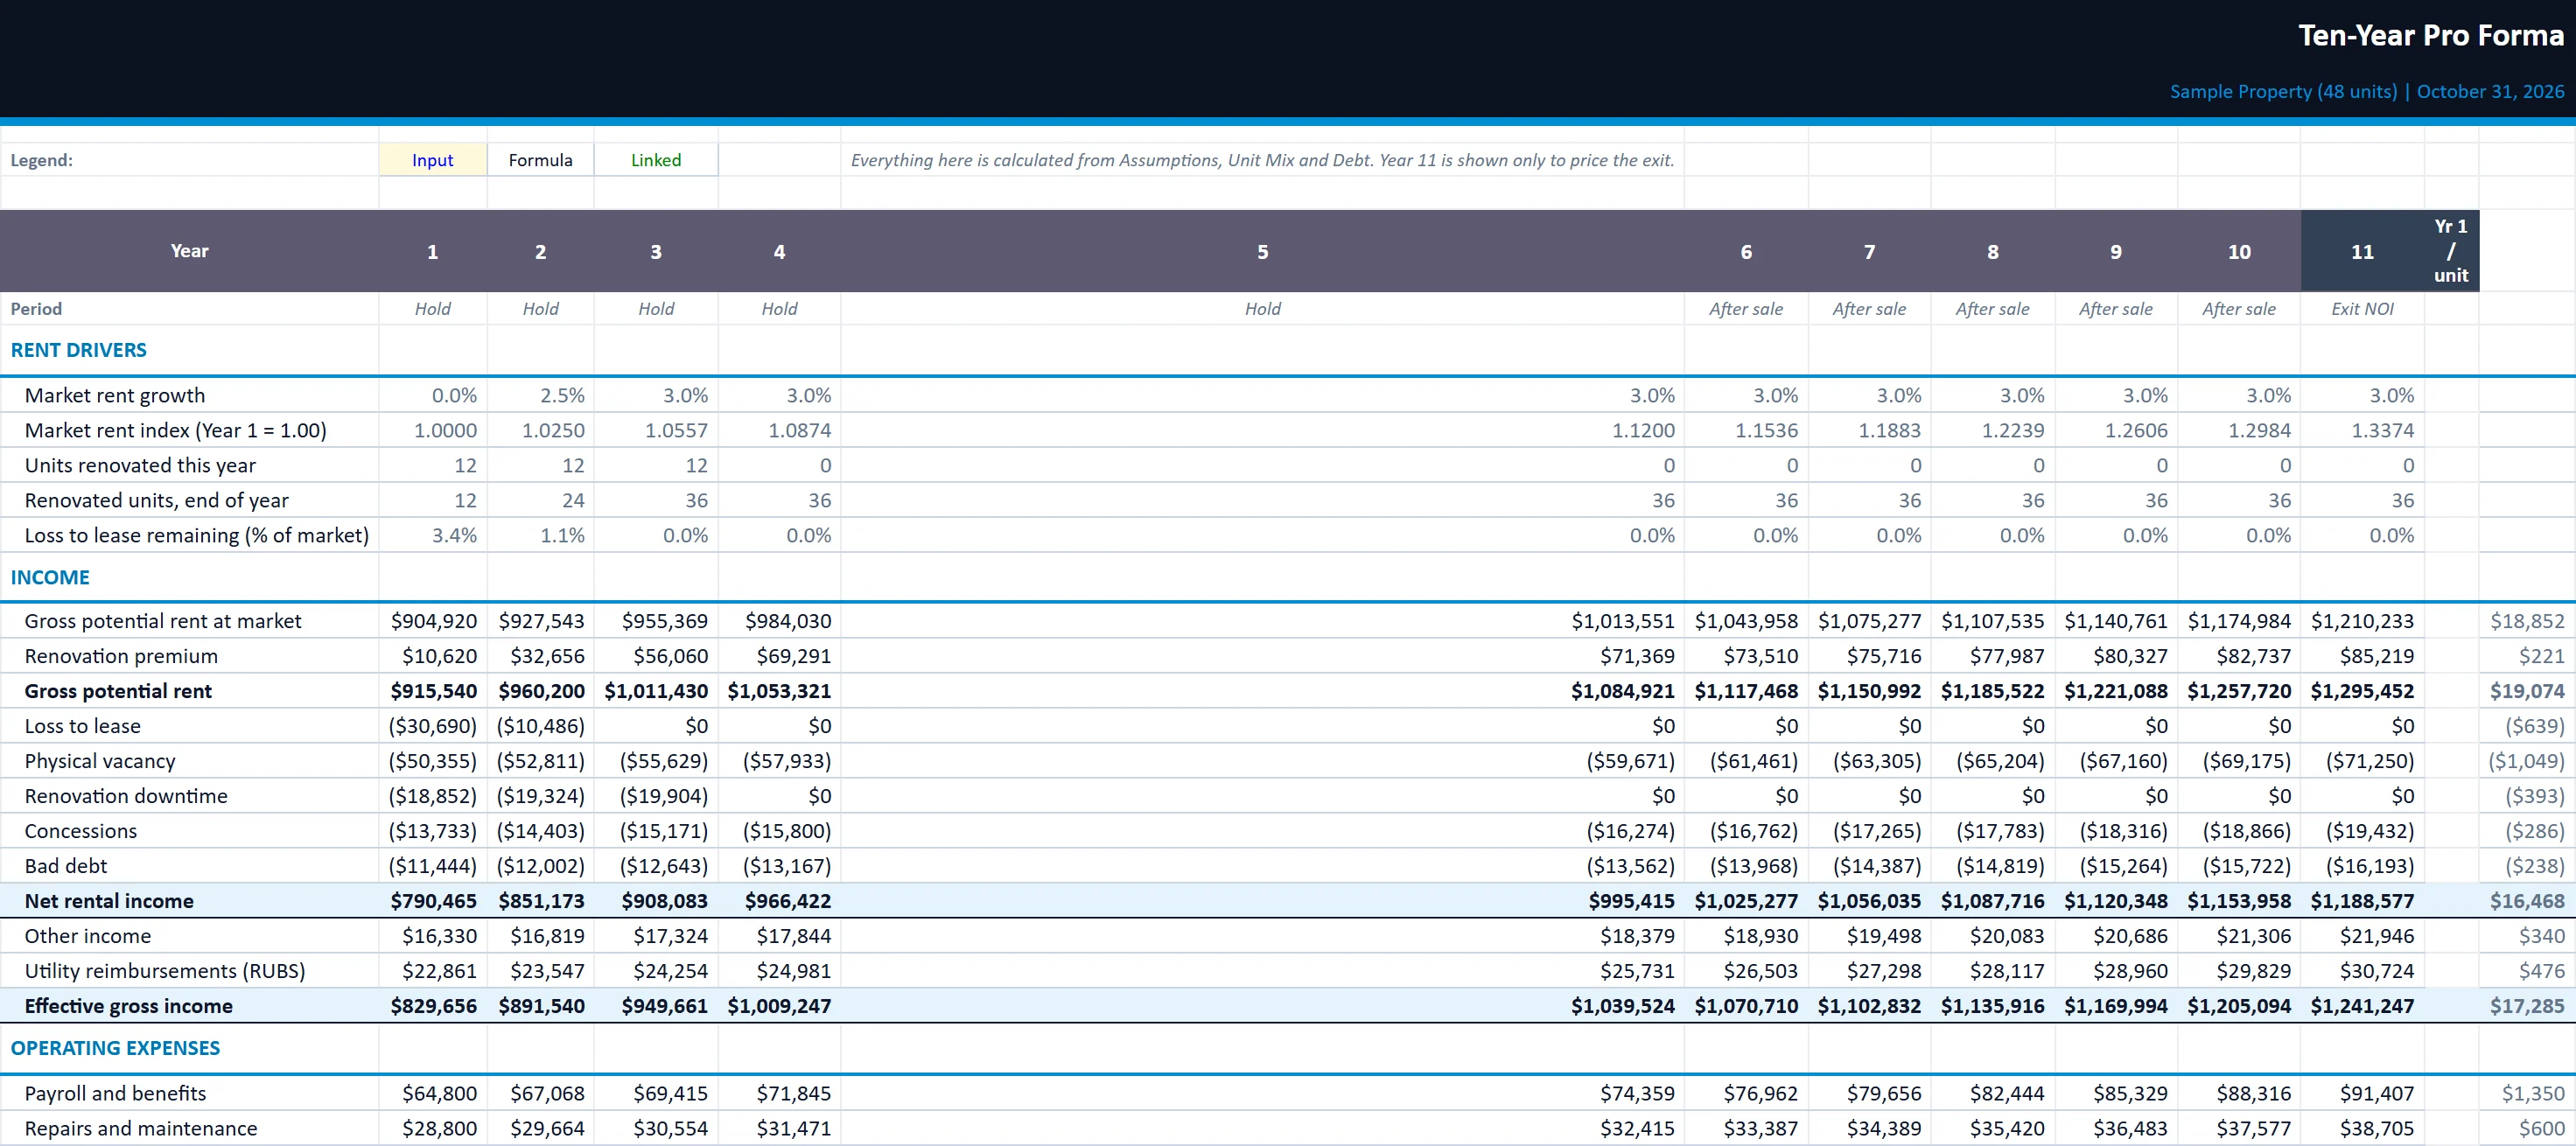
Ten-year operating projection plus a forward Year 11 for exit value: income, expenses, NOI, capex, debt service, cash flow and ratios.

acquisition-underwriting-model.xlsx
The Pro Forma tab of the acquisition-underwriting-model workbook, filled in with the sample property
DashboardPro FormaSensitivityInvestment SummaryAssumptionsUnit MixDebtReturns

Tab 3

Sensitivity

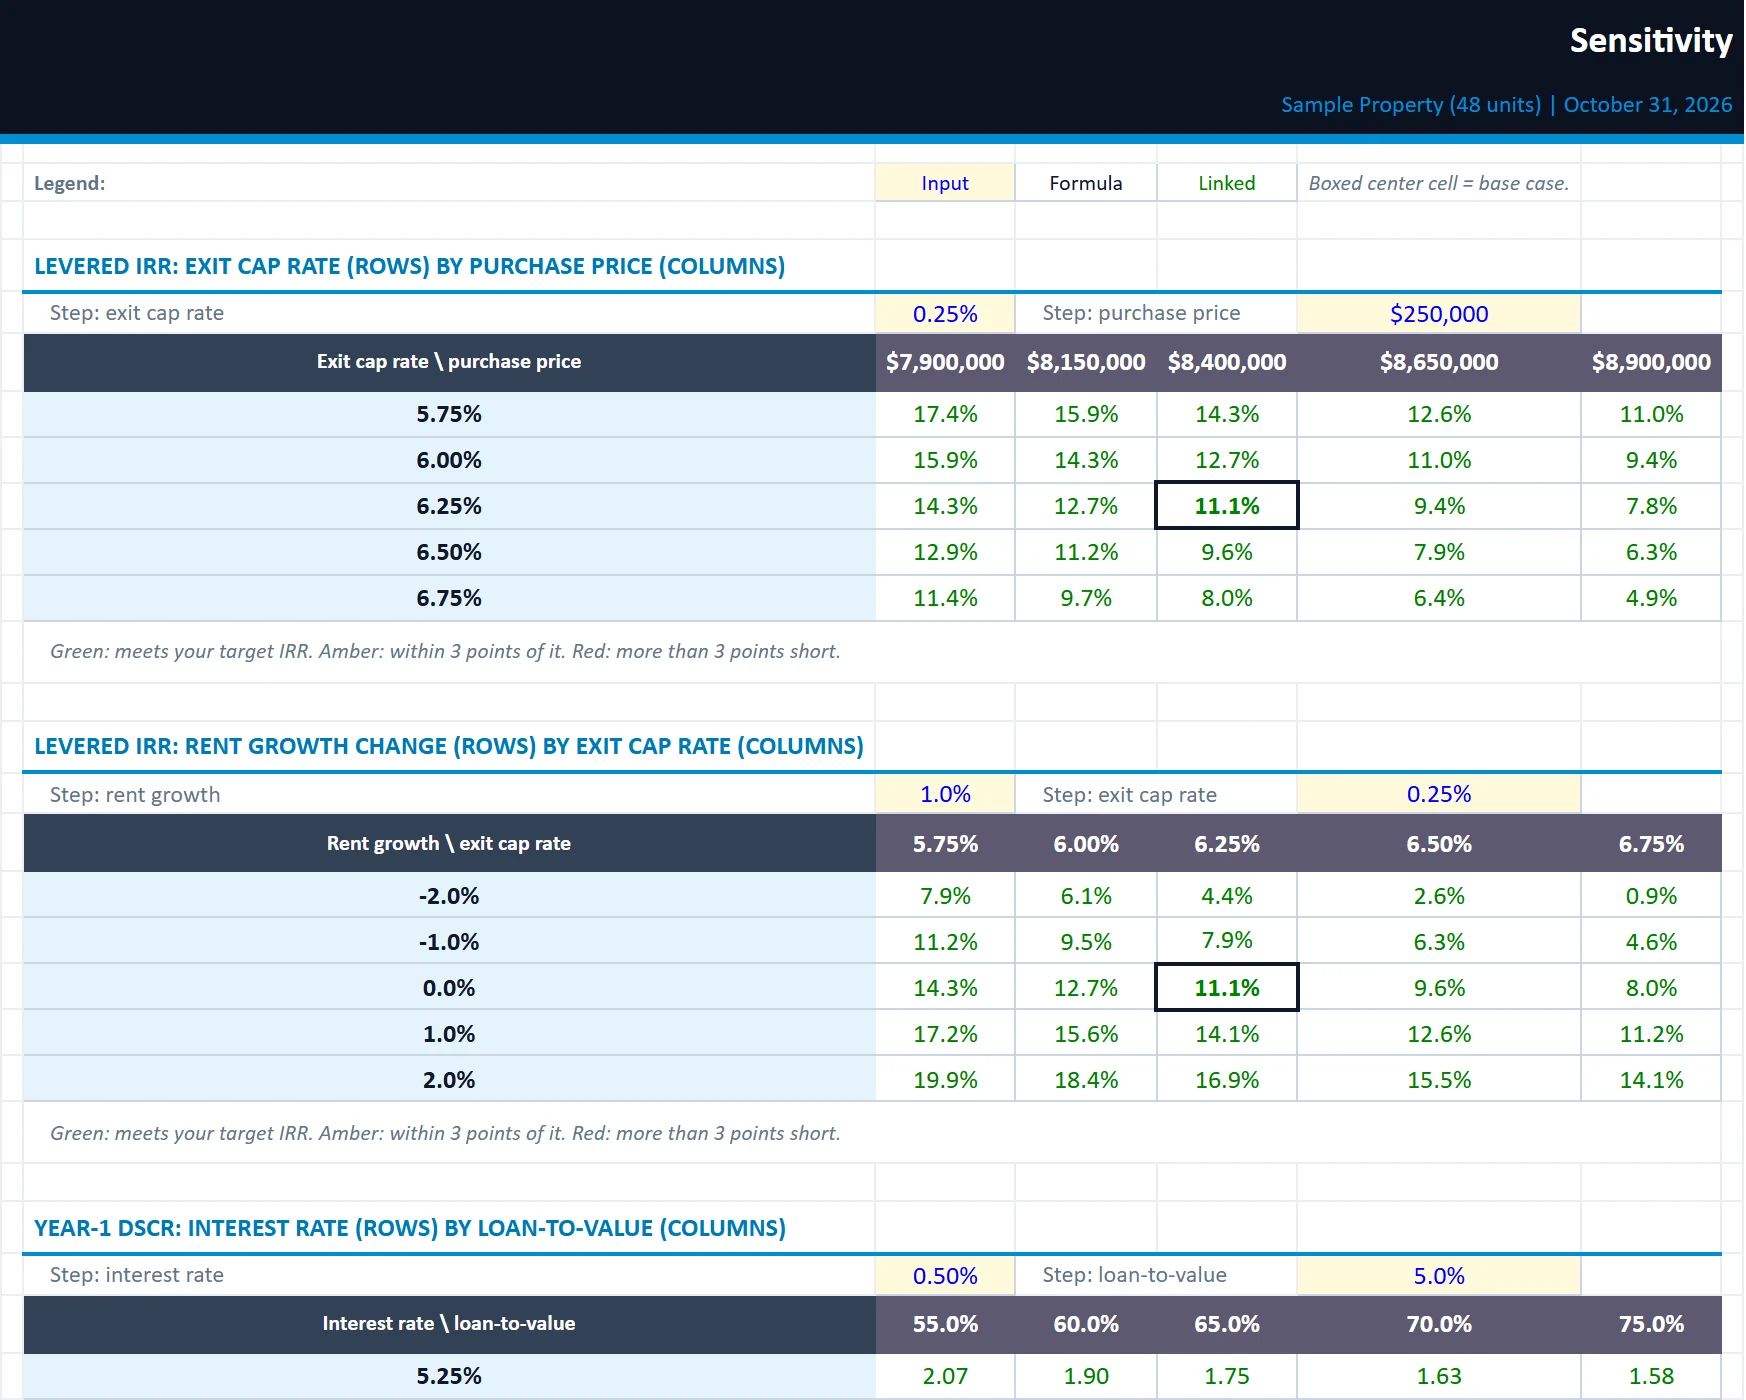
Three live 5 x 5 grids: IRR by exit cap and price, IRR by rent growth and exit cap, and Year-1 DSCR by rate and LTV.

acquisition-underwriting-model.xlsx
The Sensitivity tab of the acquisition-underwriting-model workbook, filled in with the sample property
DashboardPro FormaSensitivityInvestment SummaryAssumptionsUnit MixDebtReturns

Investment Summary

A white-label one-pager with your logo and company name for investors, partners or lenders.

Assumptions

Every input in one place: acquisition, financing and loan sizing, revenue, value-add, expenses, exit, targets and the LP/GP split.

Unit Mix

Unit types with count, square feet, in-place rent, market rent and renovation premium. Drives revenue and loss to lease.

Debt

120-month amortization schedule that honors the interest-only period, with an annual roll-up that feeds the Pro Forma and the payoff at sale.

Returns

Unlevered and levered cash flows for the selected hold, IRR, equity multiple, profit split, yield on cost and the LP/GP waterfall.

Built for

Who it is for

  • Investors deciding what to offer
  • Sponsors building a lender or investor package
  • Owners checking a broker's pro forma
Want a quick number first? Try the Building value estimator.

How to use it

Up and running in seven steps

  1. 1Enter the property details on the Start Here tab. The sample deal is a 48-unit Reno property; every yellow cell is a sample input you overwrite.
  2. 2On Unit Mix, enter each unit type with its count, average square feet, in-place rent, market rent and renovation premium.
  3. 3On Assumptions, work top to bottom: price and closing costs, loan terms, revenue, renovation plan, Year-1 expenses, exit and your targets.
  4. 4Check the loan sizing block on Assumptions. The model borrows the lesser of the LTV, DSCR and debt yield amounts and tells you which one binds.
  5. 5Pick the hold period (3 to 10 years) on Assumptions and review Pro Forma, Returns and the Dashboard insights.
  6. 6Stress the deal on Sensitivity. Change the step sizes to widen or narrow each grid. Confirm every check on the Dashboard reads OK.
  7. 7Enter your company name on the Start Here tab and drop your logo onto Investment Summary (right-click the placeholder, Change Picture) before you send it.

Rather have us run the numbers?

Send us your rent roll and T12 and we will build this for your property and show you what it says.

Questions

Acquisition Underwriting Model questions

What returns does the model calculate?
Unlevered and levered IRR, equity multiple, cash-on-cash, yield on cost and DSCR for a hold of 3 to 10 years, plus the split between limited and general partners.
How is the loan sized?
At the lesser of the loan-to-value, debt coverage and debt yield amounts you set. The model tells you which one limits the loan.
Can I test different prices and exit cap rates?
Yes. Three live sensitivity grids show IRR by price and exit cap, IRR by rent growth and exit cap, and Year-1 DSCR by interest rate and loan-to-value.

Insights

The guide behind it

All articles