The 40% Rule: Your Operating Expense Ratio and Asset Value
Two buildings with the same rents can be worth very different amounts. The gap is often the operating expense ratio. Here is how it works and what a point is worth.
Free template
A full 12-month budget for an apartment property, driven by your unit mix, with NOI, per-unit metrics, a five-year projection and monthly budget versus actual tracking.
Get the template
Inside the workbook
Tab 1
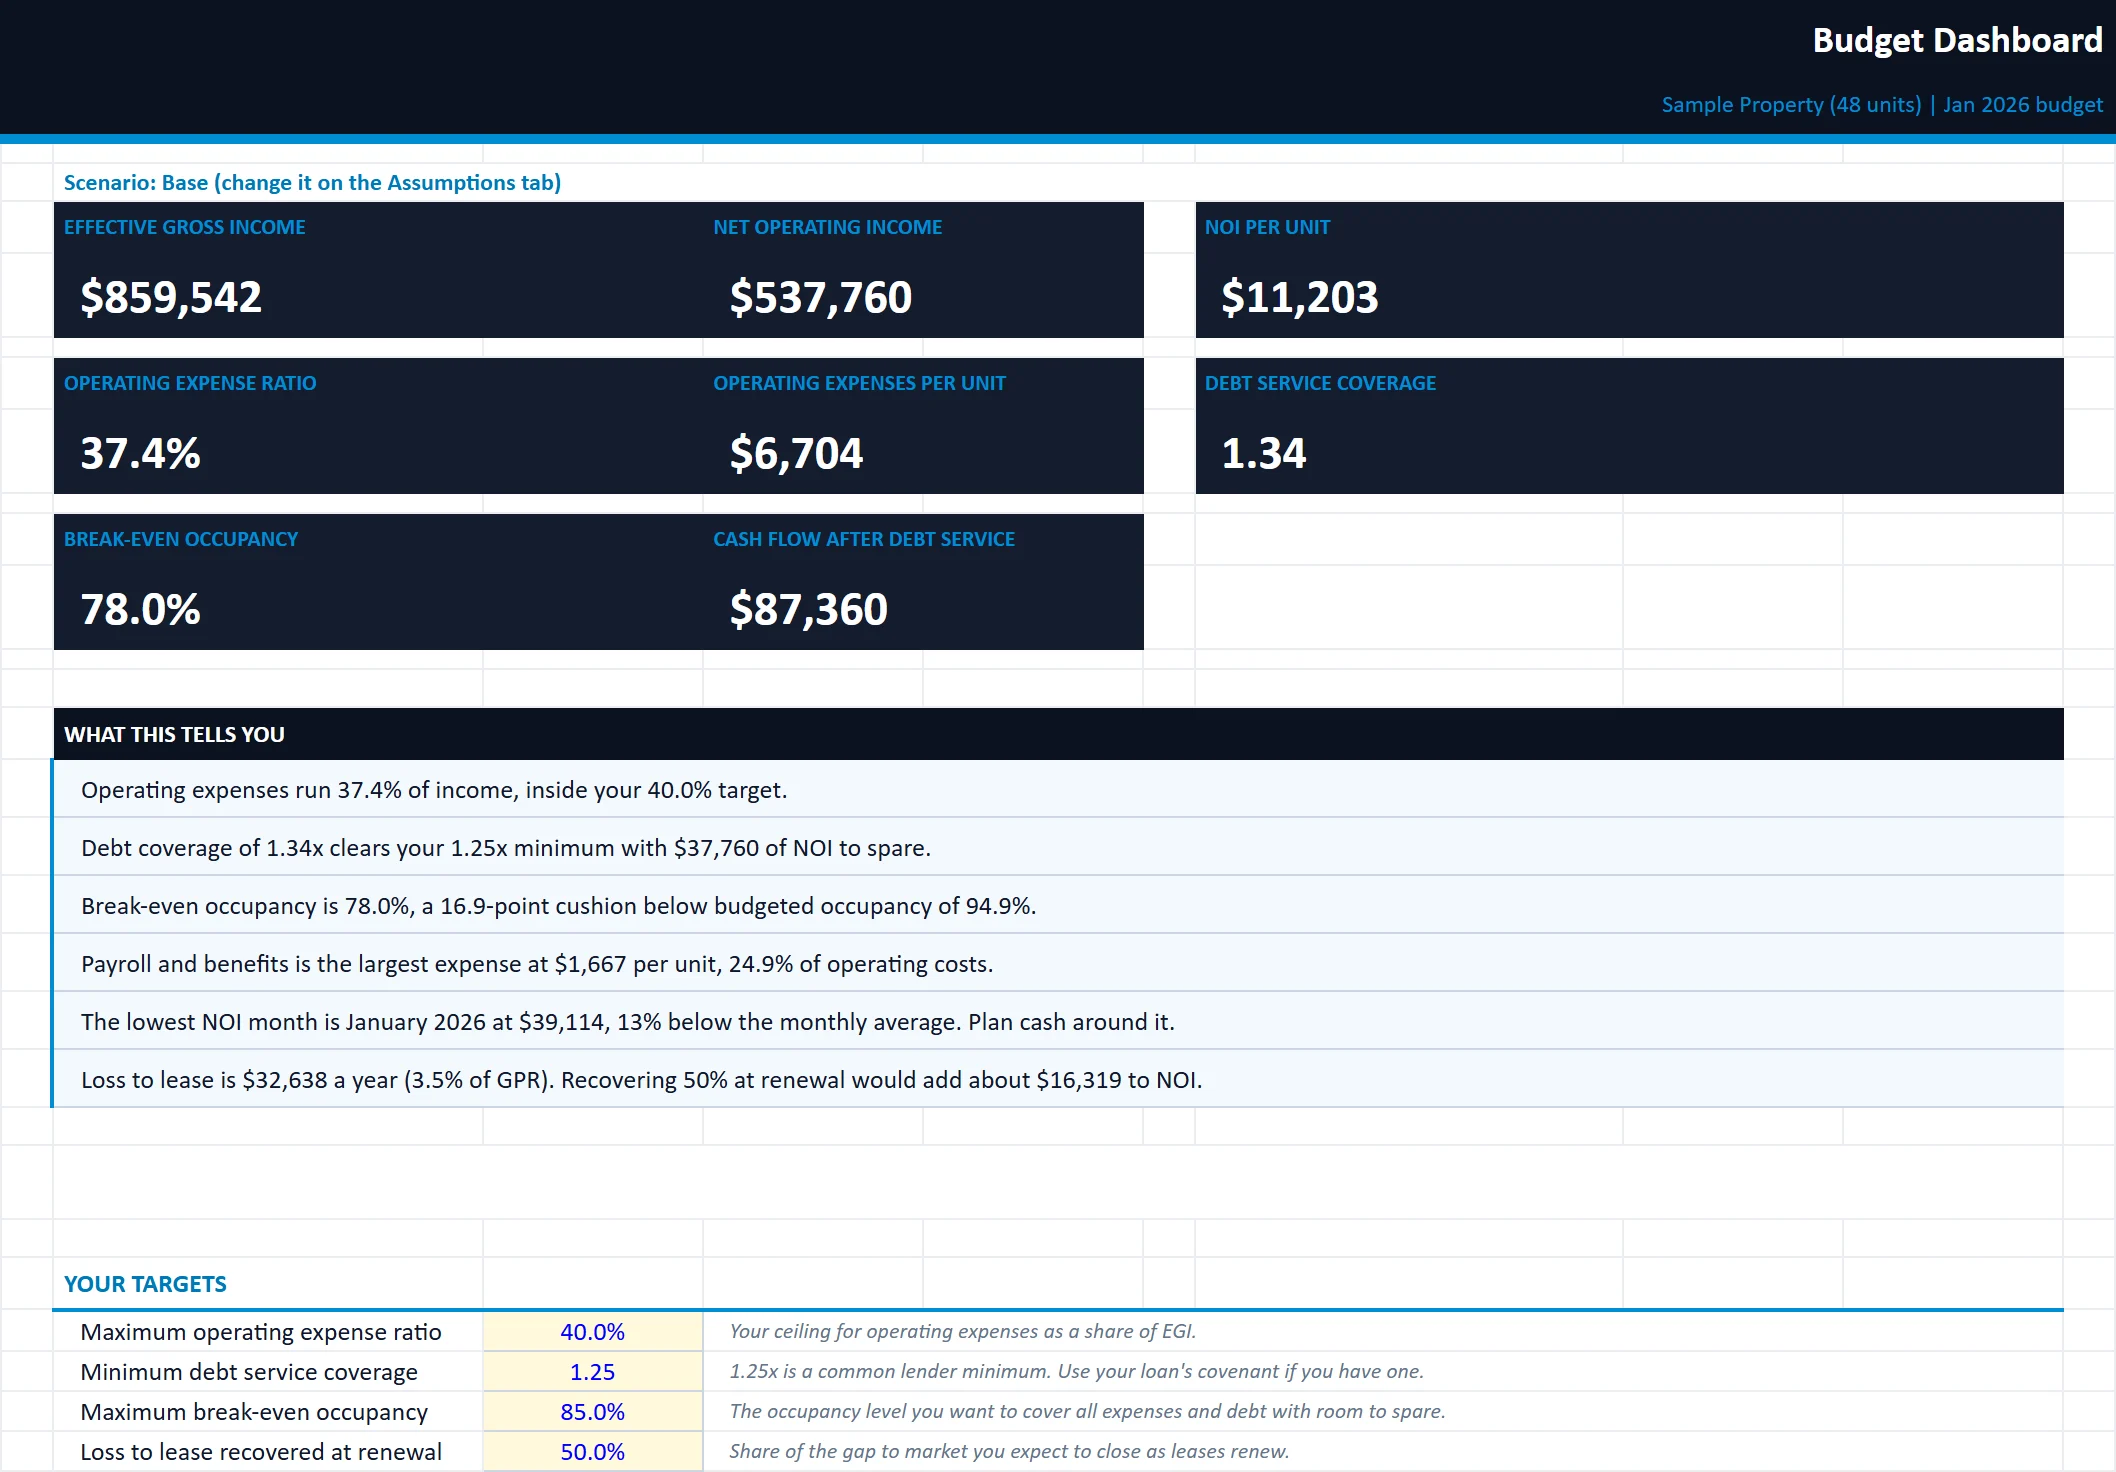
Key ratios with plain-English insights against your own targets: NOI, operating expense ratio, debt coverage and break-even occupancy.

Tab 2
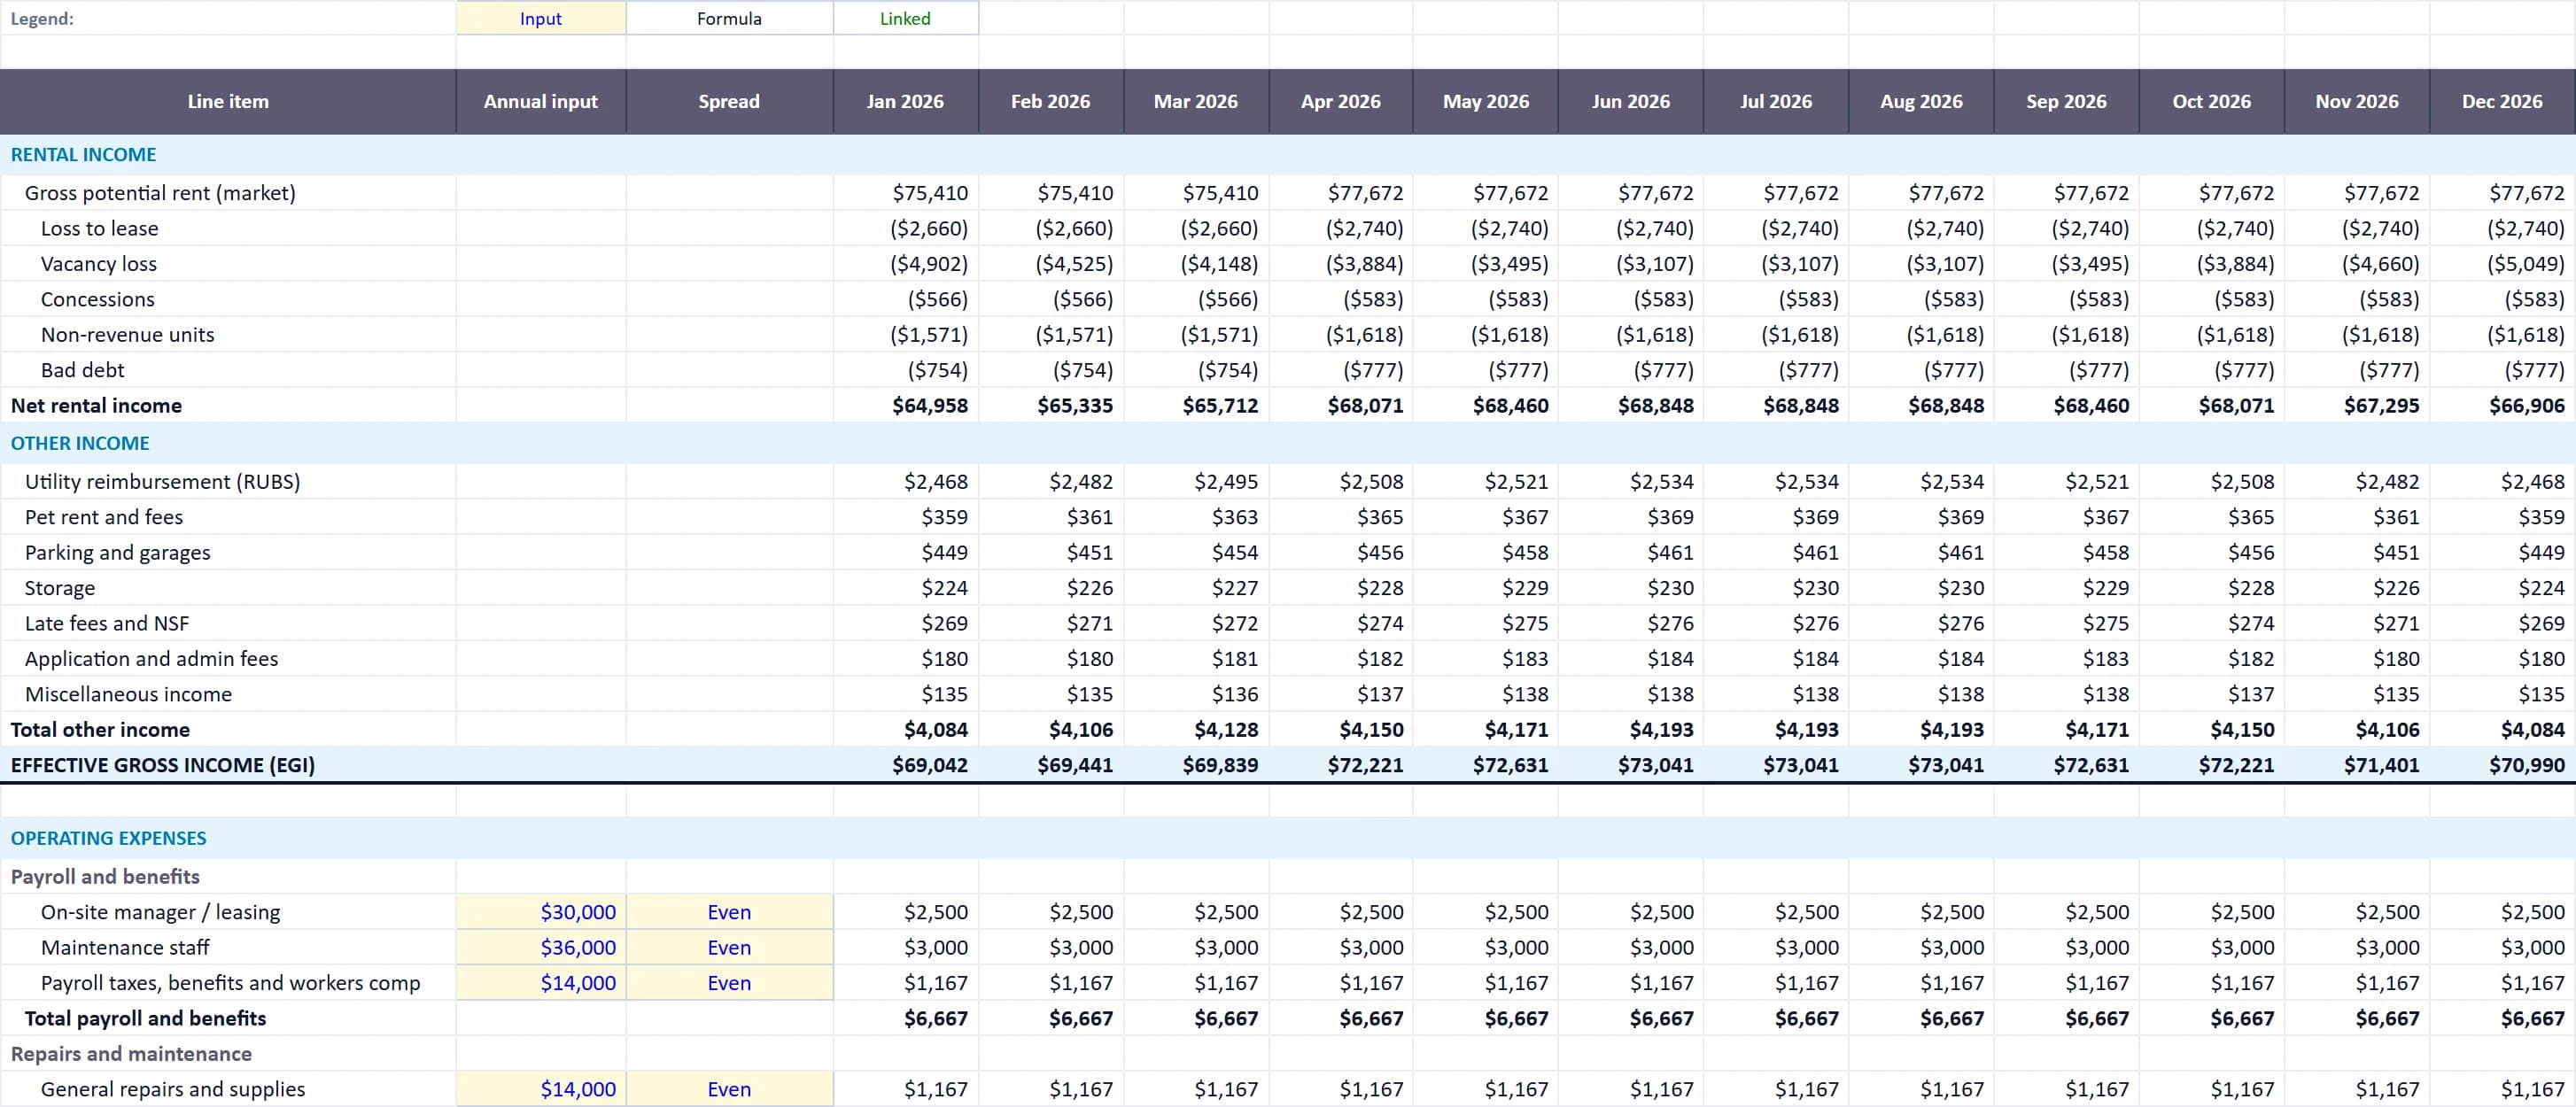
The 12-month budget: income, operating expenses, NOI, reserves, debt service and cash flow, with each line spread by a seasonal profile.

Tab 3
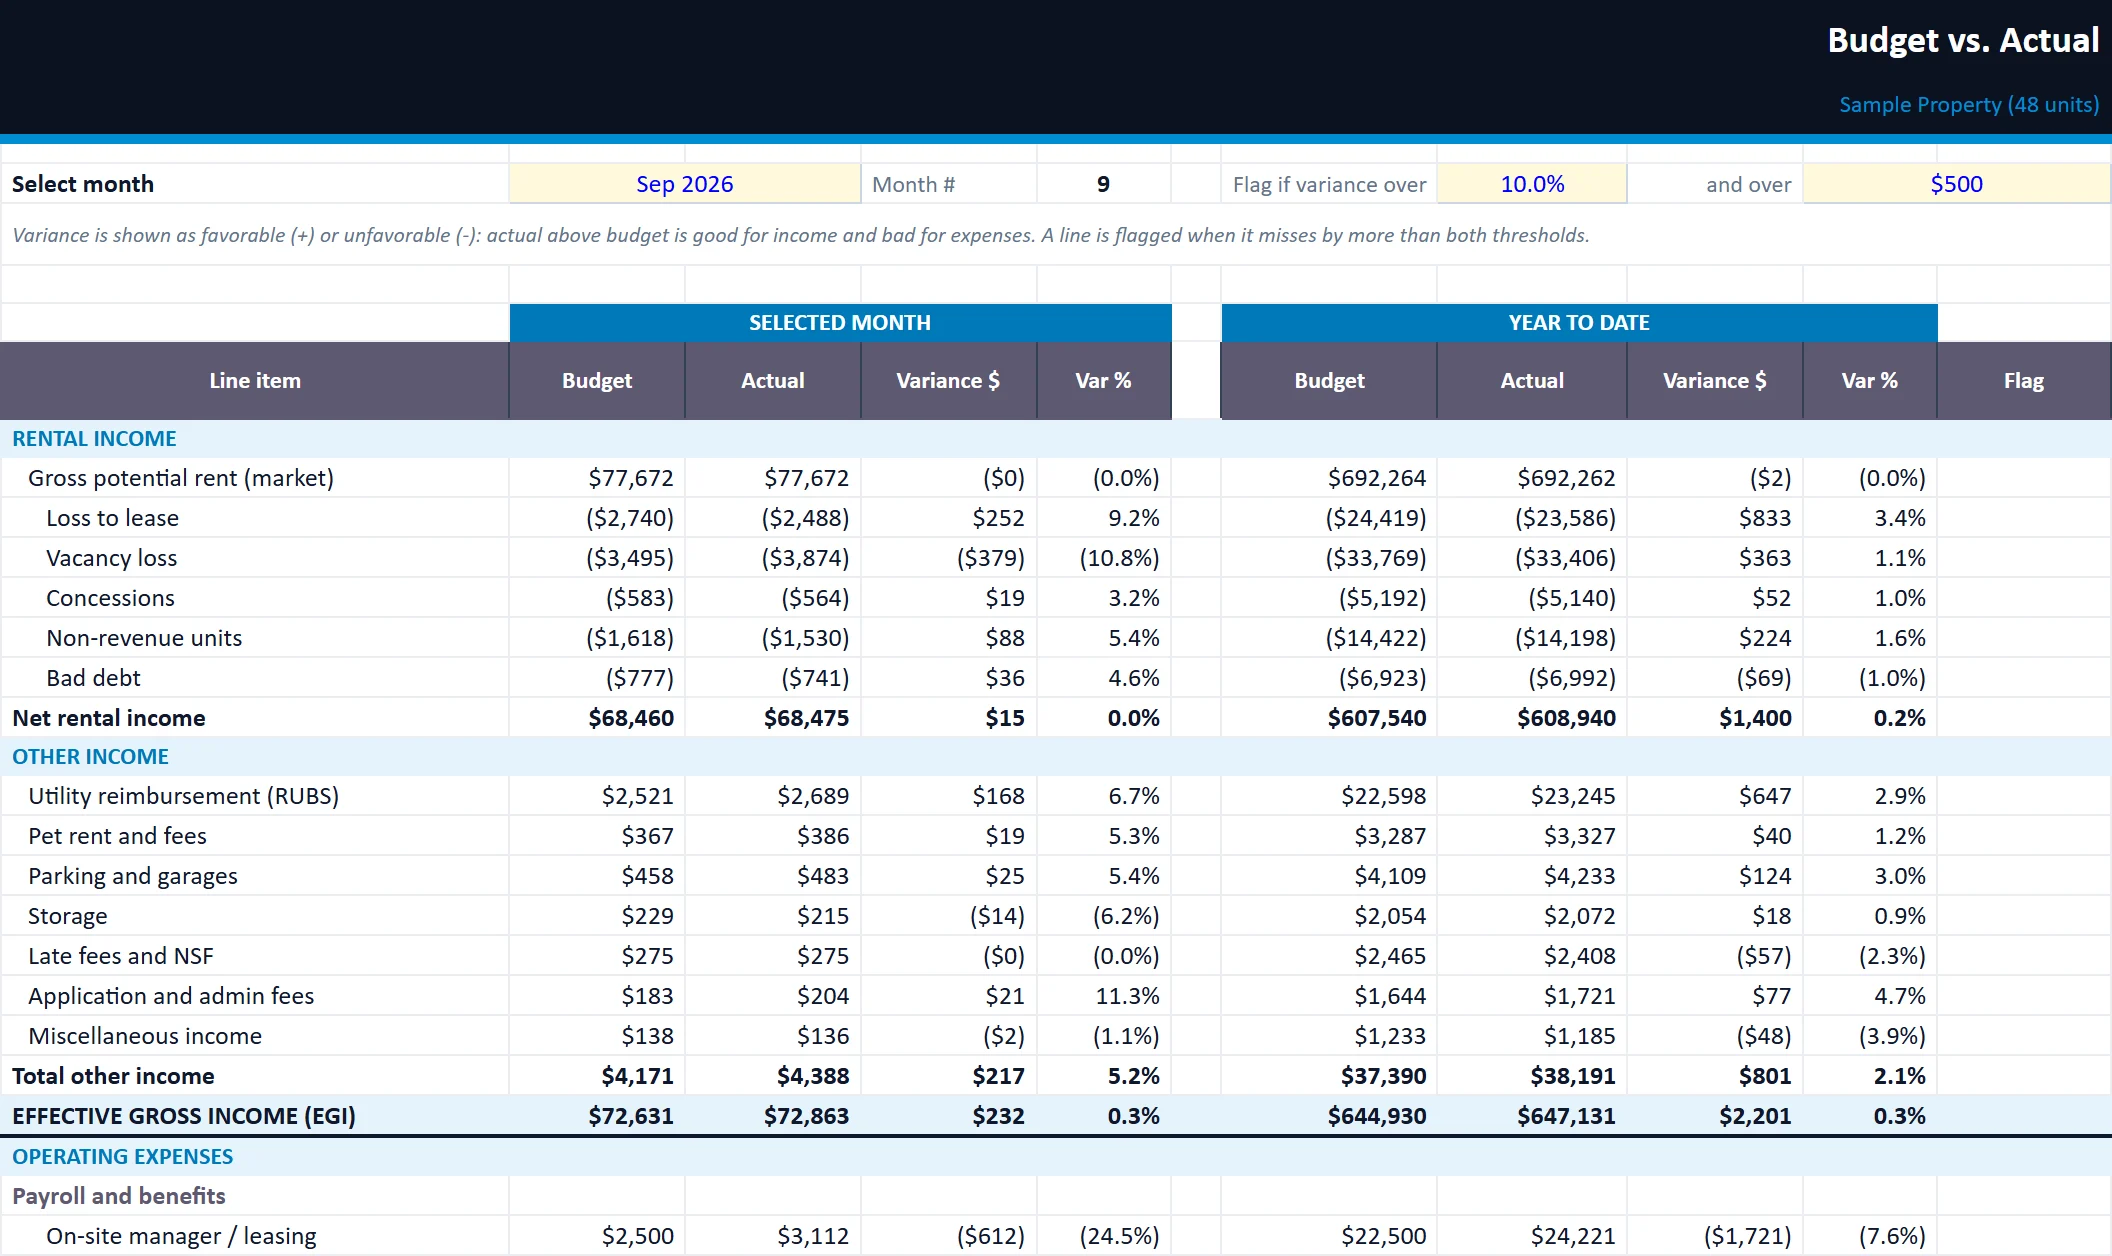
Budget versus actual for any month and year to date, favorable or unfavorable, with lines flagged for review.

Assumptions
Unit mix, vacancy by month, rent growth, other income, fees and Base, Conservative or Upside scenarios.
5-Year Projection
Carries the budget forward five years: NOI, debt coverage, cash flow and value at your exit cap rate.
Actuals
Monthly actuals in the same row layout as the budget, so pasting from your P&L lines up.
Owner Summary
A one-page, print-ready summary under your company name and logo for owners or lenders.
Built for
How to use it
Rather have us run the numbers?
Send us your rent roll and T12 and we will build this for your property and show you what it says.
Questions
Insights
Two buildings with the same rents can be worth very different amounts. The gap is often the operating expense ratio. Here is how it works and what a point is worth.