



The 2025 Recovery Story: Occupancy and Absorption
The reno multifamily market in 2025 delivered a clear recovery narrative. Occupancy climbed from 88.3% in December 2024 to 91.4% by year-end 2025, representing a 3.1 percentage point gain. This wasn’t just seasonal fluctuation. The market absorbed 2,931 units throughout the year while adding only 965 new units. That means the market filled not just new supply but also backfilled 1,966 previously vacant units from struggling lease-ups.
The year didn’t follow a straight line. Q1 started at 88.7% occupancy, barely above 2024’s close. Q2 actually dropped to 87.7% as new supply hit faster than absorption. Then came the inflection point. Q3 surged to 90.7% with 1,975 units absorbed in a single quarter, the strongest quarterly performance I’ve seen in years managing properties across Northern Nevada. Q4 held at 91.4% despite negative absorption of 108 units, suggesting active lease-ups finally stabilized.
Here’s what makes this significant: stabilized properties (excluding active lease-ups) performed even stronger, ending 2024 at 94.3% occupancy. That 2.9 percentage point gap between overall market and stabilized occupancy reveals the continued challenges facing new developments trying to fill up. If you’re evaluating an acquisition, this gap matters. Stabilized assets command premium pricing because they’ve proven they can maintain occupancy through market cycles.

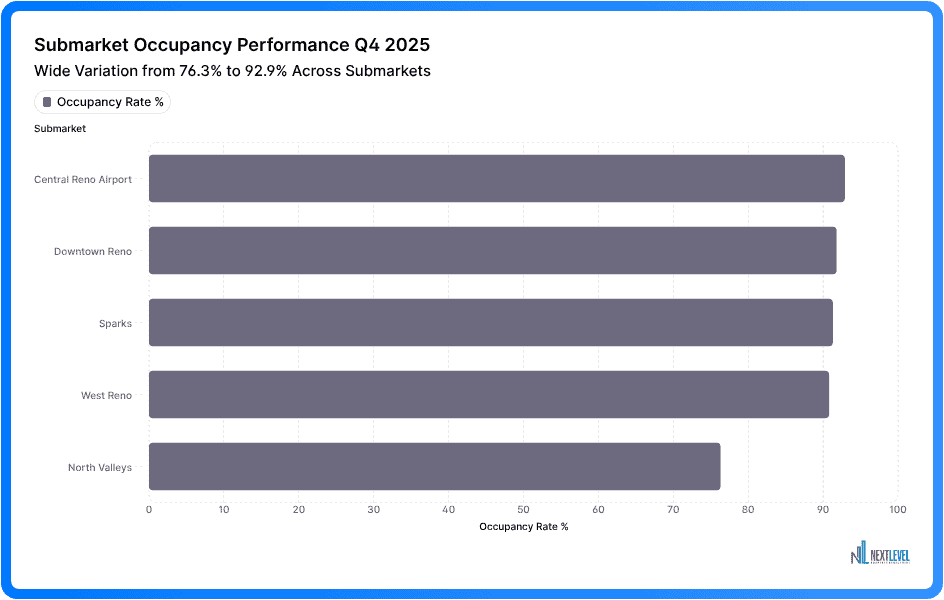
Submarket occupancy variations tell an even more interesting story. Downtown Reno showed the most dramatic recovery, climbing from 70.4% in December 2024 to 91.8% by year-end 2025, a 21.4 percentage point gain. West Reno jumped 9.9%, Sparks gained 7.7%, while Central Reno/Airport’s steady performance rose 3.5% to 92.9%. These aren’t just statistics. They represent thousands of leases signed, millions in revenue captured, and significant capital formation for owners who maintained discipline through the supply shock.
Rent Growth in Context: What 5.5% Really Means
Effective rents ended 2025 at $1,713, up 5.5% year-over-year from $1,622 in December 2024. On a per-square-foot basis, that’s $1.93/SF, also up 5.5%. Average asking rents reached $1,743, creating a $30 gap between asking and effective rent. That gap represents the aggregate concession burden across the market, though I’ll show you later why this number may be significantly understated.
Let me put 5.5% rent growth in context. During the pandemic boom years of 2020-2021, we saw 10-15% annual gains. Operators became accustomed to double-digit rent increases covering operating expense inflation and then some. Those days are over. The 5.5% we achieved in 2025 represents the new normal, modest but consistent growth in favorable years, flat to low-single-digit growth in challenging years.
Here’s why this matters for your underwriting. Operating expenses haven’t stopped inflating. Insurance, utilities, wages, and maintenance costs continue rising at 4-6% annually. When rent growth is 5.5% and expense growth is 5%, your NOI expansion is minimal. Properties that underwrote 8-10% annual rent growth in their acquisition models are feeling the squeeze. The math doesn’t work anymore.
This is particularly critical for properties acquired in 2021-2022 at peak pricing with aggressive rent growth assumptions. If your pro forma assumed 8% annual rent growth and you’re achieving 5.5%, that’s a 2.5% annual shortfall. Compounded over a five-year hold, that shortfall becomes material to your exit valuation.
The Concession Reality: Where Market Data and Ground Truth Diverge
Here’s where I need to address something critical that affects every investment decision in this market. There’s a significant gap between reported concession data and what we’re seeing on the ground.
Industry reports show approximately 23% of properties offering concessions at year-end 2025, with an average package around 6.2% of annual rent. Our direct market research tells a very different story. We contacted 10 communities across different submarkets, and all 10 confirmed they’re currently offering 1-2 months free rent, plus Look N Lease specials ranging from $500-1,000. That’s 100% concession activity in our sample versus the reported 23% market-wide.
Let me show you why this matters mathematically. One month free on a 12-month lease equals 8.3% concession. Two months free equals 16.7%. Three months free equals 25%. We’ve even seen properties offering six months free, a 50% concession that effectively cuts annual revenue in half for those units. So when reported data shows an average concession package of 6.2%, that doesn’t even cover one month free, let alone the 1-2 months that appears standard across the market.
Why the disconnect? I believe there are two primary factors. First, many property managers may not be calculating effective rent properly or consistently reporting all concession types. The mechanics of effective rent calculation can be complex, and without standardized reporting requirements, data quality varies. Second, Look N Lease specials (those $500-1,000 bonuses paid directly to residents) often aren’t captured in concession data at all, even though they represent an additional 2-4% effective rent reduction.
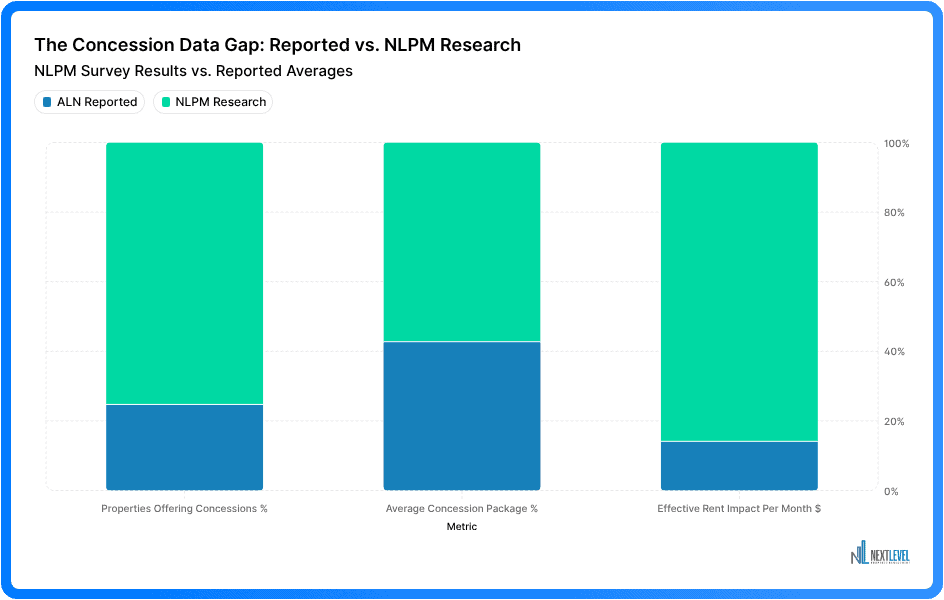
Because effective rent is calculated by reducing asking rent by the concession percentage, if concessions are understated, effective rents are overstated. If we apply what we’re seeing on the ground, a more realistic 15% average concession load across the market, the math changes dramatically. Asking rent of $1,743 minus a 15% concession ($262) gives us an actual effective rent around $1,481. That’s $232 per month lower than reported, or 15.7% potentially overstated.
For a 200-unit property, that’s $46,400 per month or $556,800 annually in potential revenue discrepancy. This has massive implications for underwriting, lending, and valuation. If you’re evaluating an acquisition, I strongly recommend conducting your own ground-level research on actual concession packages rather than relying solely on reported market data. Call properties directly. Talk to leasing agents. Get real-time concession information. The data providers offer valuable insights on many metrics, but the concession reporting appears to have systematic issues across the industry.
Pipeline Analysis: Where Supply Pressure Remains
As of December 2025, the reno multifamily market 2025 pipeline stands at 5,047 units, down significantly from approximately 12,069 units at the end of 2024. That 58% reduction represents roughly 7,000 units delivered throughout 2025. The good news is supply pressure is easing. The concerning news is what remains isn’t evenly distributed.
Three submarkets contain the vast majority of upcoming supply. North Valleys has 1,810 units (36% of total pipeline), the highest concentration and most concerning given the submarket’s occupancy volatility. Downtown Reno has 1,511 units (30% of total pipeline). West Reno has 1,502 units (30% of total pipeline). Those three submarkets account for 96% of the remaining pipeline.
The remaining submarkets show more manageable numbers. Sparks has 1,023 units, Central Reno/Airport has 904 units, and Carson City has 599 units. These markets have consistently absorbed supply without the wild occupancy swings we’ve seen in North Valleys or Downtown.

Looking ahead to 2026, only 1,060 units are scheduled to start leasing across the next four quarters. That’s dramatically lower than approximately 2,300 units in 2025, a 54% reduction in new supply. The quarterly breakdown shows Q1 2026 at 350 units (the heaviest quarter), Q2 at 175 units, Q3 at 335 units, and Q4 at 200 units. After Q1, supply pressure should ease significantly.

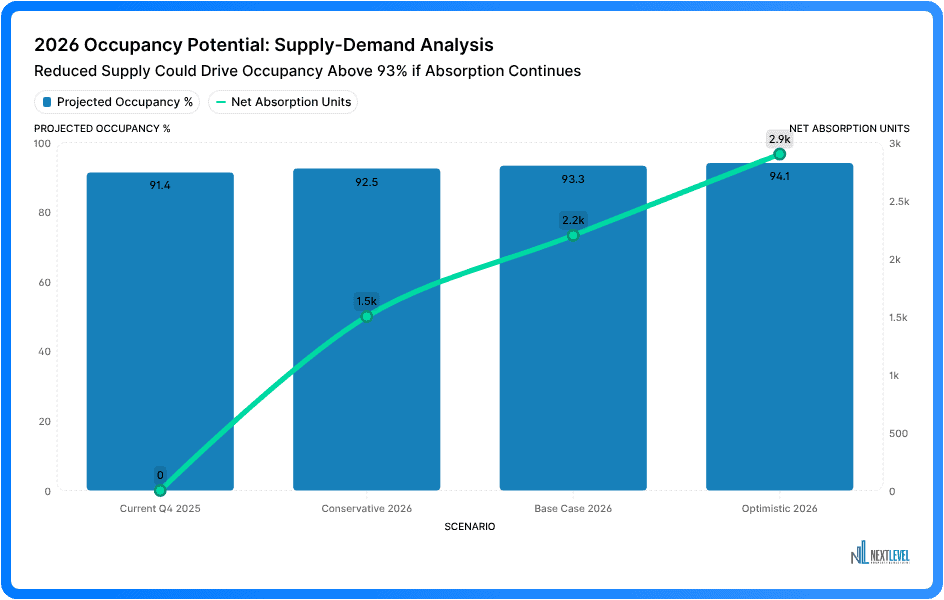
If absorption continues at 2025 levels (2,931 units) and only 1,060 new units start leasing, the market could absorb 1,871 units of existing vacancy. This would drive occupancy well above 91.4% and finally give operators pricing power to reduce or eliminate concessions. However, this assumes stable economic conditions and continued job growth. Any economic disruption changes the equation entirely.
Submarket Deep Dive: Winners, Losers, and Risk Assessment
Let me break down what happened in each major submarket, because aggregate market data masks critical variations that determine investment success or failure.
Downtown Reno delivered the most dramatic story of 2025. Occupancy started the year at 84.1% in Q1, then collapsed to 68.2% in Q2 as massive new supply overwhelmed demand. That’s crisis-level occupancy where properties burn cash and lenders get nervous. Then came the recovery. Occupancy surged to 76.5% in Q3, a 12.3 percentage point jump in one quarter, and finished at 91.8% in Q4. Year-over-year, Downtown occupancy climbed 21.4 percentage points. I’ve never seen recovery that fast in modern Reno multifamily history.
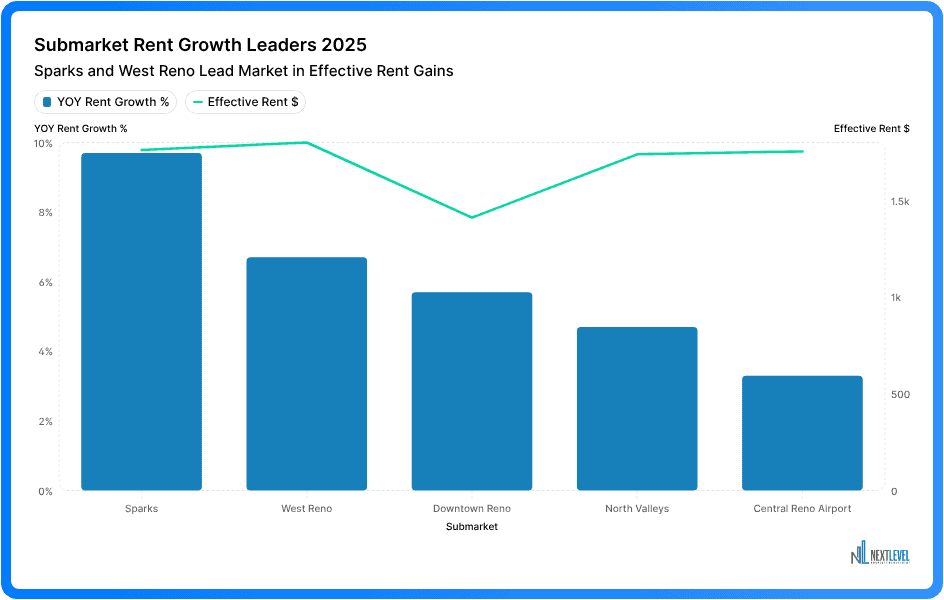
Effective rents told a similar recovery story, finishing at $1,411, up 5.7% year-over-year. But here’s the catch: Downtown still has 1,511 units in the pipeline. The market absorbed approximately 2,326 units in 2025, but at what cost? Many properties resorted to 2-3 months free plus Look N Lease bonuses. Properties like Ballpark Apartments struggled with premium pricing despite aggressive concessions. In contrast, Grand Canyon Mews near Midtown completed their lease-up in mid-2025 with exceptional rents and zero concessions. The difference was marketing strategy, realistic pricing, and execution excellence.
Central Reno/Airport quietly delivered the most consistent performance. Occupancy ended at 92.9%, up 3.5% year-over-year. Quarterly performance showed remarkable stability, never dropping below 90% throughout 2025. Effective rents finished at $1,754, up 3.3% year-over-year. While rent growth lagged Downtown (5.7%) and Sparks (9.7%), the stability more than compensates. Central/Airport rents are also significantly higher than Downtown ($1,754 vs. $1,411), reflecting superior location and tenant quality.
The pipeline situation favors Central/Airport. Only 904 units remain, down from 2,394 units at the end of 2024. The market absorbed approximately 1,490 units without breaking a sweat. This is the lowest pipeline concentration of any major submarket, creating favorable supply-demand balance heading into 2026. For institutional investors focused on risk-adjusted returns, this is where attention should be.
North Valleys is the most volatile and concerning submarket. Occupancy ended 2025 at just 76.3%, the lowest by a wide margin. Quarterly performance showed extreme swings: Q1 started at 90.8%, collapsed to 76.6% in Q2 (a 15.6 point drop), recovered slightly to 81.5% in Q3, then dropped again to 76.3% in Q4. Supply overwhelmed demand despite year-over-year rent growth of 4.7% (effective rents at $1,739).
The pipeline problem compounds this. North Valleys has 1,810 units remaining, 36% of the metro’s total pipeline. With occupancy already at 76.3%, adding 1,810 more units is a recipe for disaster. Unless demand dramatically improves or supply gets cancelled, North Valleys faces continued occupancy struggles through 2026 and potentially 2027. Avoid new development here at all costs.
For opportunistic value investors, distressed assets may present buying opportunities as overleveraged owners face refinancing pressure, but even those plays require exceptional operational expertise.
West Reno delivered strong performance with occupancy climbing from 82.9% to 90.8%, a 9.9 percentage point gain ranking second only to Downtown’s surge. Effective rents reached $1,800, up 6.7% year-over-year and the highest of any submarket except Central/Airport. West Reno attracts families and professionals seeking suburban living, good schools, and Lake Tahoe proximity. The 1,502-unit pipeline is substantial but manageable given proven absorption capacity.
Sparks is no longer the budget option, it’s a legitimate quality market. Occupancy ended at 91.3%, up 7.7% year-over-year. But the real story is rent growth: effective rents hit $1,761, up 9.7%, the highest rent growth of any submarket in 2025. Economic development is driving this. Tesla’s Gigafactory, expanded retail along Vista Boulevard, and improved highway access have transformed Sparks. Renters are willing to pay premium rents for new, quality apartments in locations that weren’t desirable five years ago.
The True Cost of Marketing in 2026: ILS, Concessions, and Retention
Let me walk you through what cost per lease actually looks like in 2026, because most operators don’t calculate this correctly. The ILS promotional pricing that benefited properties throughout 2025 is ending. Zillow Premium Package now costs $725/month (was often $400-500 with promos). Apartments.com Platinum is $1,210/month. Combined, that’s nearly $2,000/month just for ILS placement.
Add social media advertising at $500-700/month, search ads at $600-800/month, SEO at $300-400/month, and graphic design at $150-300/month. A property’s total marketing spend easily reaches $3,500-4,500/month. For a 40-unit property with 20% annual turnover (8 leases per year), that translates to $4,500-5,600 cost per lease from marketing spend alone.
Now add concessions. Two months free on a $2,200/month apartment equals $4,400 in foregone revenue. Total cost per lease climbs to $8,900-10,000. That’s four months of rent just to fill a single vacancy. The math doesn’t work.
Here’s the brutal retention challenge this creates. Residents can typically save 17-25% on annual housing costs just by moving in a concession-heavy market. Even residents who love where they live are economically incentivized to move every year. When renewal comes up and they see competitors offering 2 months free, they’re essentially being offered a $4,400 bonus to switch properties. That’s powerful motivation.
This is why properties offering aggressive concessions are creating turnover machines. Many of these are great, new Class A communities with excellent product quality. The issue isn’t the buildings, it’s the business model. Operators who train residents to expect concessions are building unsustainable operations that require constant marketing spend to backfill self-created turnover.
We’ve also seen several properties in the news recently for poor management. These stories matter because property management quality is now a competitive differentiator. When residents are economically incentivized to leave, a single negative experience, slow maintenance response, unprofessional staff, unresolved noise complaints, gives them the excuse to capture that 17% savings by moving.
2026 Outlook and Strategic Recommendations
Looking ahead to 2026, several factors will shape market performance. Supply pressure eases dramatically with only 1,060 units starting lease-up versus 2,300 in 2025. If absorption continues at 2025 levels, occupancy could push above 93% by year-end, finally giving operators pricing power to reduce concessions. However, that outcome requires stable economic conditions and continued job growth.
For investors, focus on stabilized properties in Central Reno/Airport and West Reno. These submarkets offer lower volatility and stronger fundamentals. Avoid lease-ups in Downtown and North Valleys, too much competition, too much concession activity, too much execution risk. Underwrite 10-15% effective rent concessions through H1 2026 based on ground-level research rather than relying solely on reported market data. Watch for distressed selling opportunities in Q1-Q2 2026 as overleveraged owners face refinancing pressure.
For developers, pause new projects in Downtown and North Valleys until existing pipeline clears. Consider Central/Airport and West Reno if you must develop, these submarkets have more manageable pipelines. Underwrite 18-24 month lease-ups, not the 12-14 months of previous years. Budget for professional marketing from day one. The difference between a 12-month and 24-month lease-up is millions in lost NOI. Be realistic on pricing. Conduct your own ground-level research on current effective rents and actual concession packages, and assume conservative concession levels in your pro forma.
For operators and property managers, invest in professional apartment marketing, it’s cheaper than concessions. A $2,000/month marketing budget delivering 8 leases at $250 each is better than 8 leases with $4,400 in concessions. Focus on retention to reduce the 17-25% concession churn. Fast maintenance response, professional communication, and genuine community building matter more than you think. Don’t overshoot on concessions. If the market needs 1 month free, don’t offer 3 months just to compete faster. Every extra month erodes NOI and trains residents to expect more.
The winners in 2026 will be operators who understand that professional marketing beats discounting. Properties that invest in conversion optimization, maintain high service standards, and focus on retention will dramatically outperform those stuck in the concession trap. The difference between an $800 cost per lease and an $8,000 cost per lease is the difference between strong NOI and burning cash.
The reno multifamily market 2025 proved demand exists. The market absorbed nearly 3,000 units despite adding significant supply. But it came at a cost through widespread concessions and rising marketing expenses. The opportunity in 2026 is capitalizing on reduced supply pressure while avoiding the concession treadmill that destroys NOI. Operators who execute with discipline and sophistication will find this market rewarding. Those who rely on discounting and hope will continue struggling.